This powerful report is designed to help you perform statistical comparisons between two datasets and prepare well formatted spreadsheet reports containing the results.
The statistical methodology for this report was adopted from work performed by Jason Maze, P.E., of URS Corporation who, with the assistance of Dr. Chris Wilson (the author of WRDB) prepared software to evaluate the performance of various best management practices (BMPs). The methods are described in detail in the report Analytical & Statistical Methods TM prepared in March 2006. Please refer to this report for detailed information. Note that not all analyses described in the report were incorporated into WRDB because they weren't all applicable.
To use this tool, it is not necessary to select the data you want to use first (data selection is part of the tool). Select Output | Reports | Summarize By | Comparative Statistics; after a momentary delay, you will see this form:
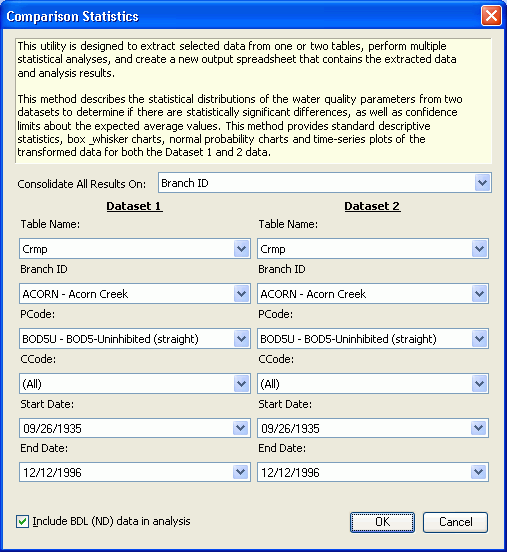
WRDB will compile all data from Dataset 1 and compare it to data from Dataset 2. These datasets can be extracted from the same or different tables. By using the "Consolidate All Results On" selection, you can consolidate data by grouping on one of the following:
Station ID
Branch ID
8-Digit HUC
12-Digit HUC
Here are some types of questions you can answer with this report:
Are there significant differences between observations:
of BOD5 inhibited and uninhibited tests?
of Total Dissolved Solids at station A and B?
of Dissolved Oxygen in the 1980s and 1990s?
collected on the Coosa and Chattahoochee Rivers?
The checkbox "Include BDL (ND) data in analysis" is used to select whether the routine will incorporate "below detection limit" (or "non-detect") observations in the statistical analysis. Note that if you do, an advanced statistical method for handling these values is utilized (see BMP report page 6).
When you open the form, select the criteria for the two datasets and then the OK button. WRDB will compute the statistics and create an Excel spreadsheet containing the results (you must have a version of Microsoft Excel on your computer to create this report). The analysis results are placed on several sheets.
Summary Statistics:
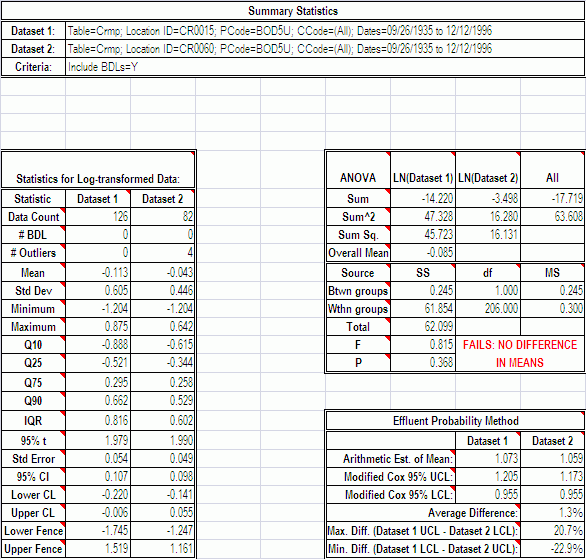
Note that the red triangles in the upper right corner of the cells indicate that an Excel comment is attached. Hover your mouse to see an explanation of that particular cell. See pages 14-16 of the BMP report for more information.
Box & Whisker Plots:
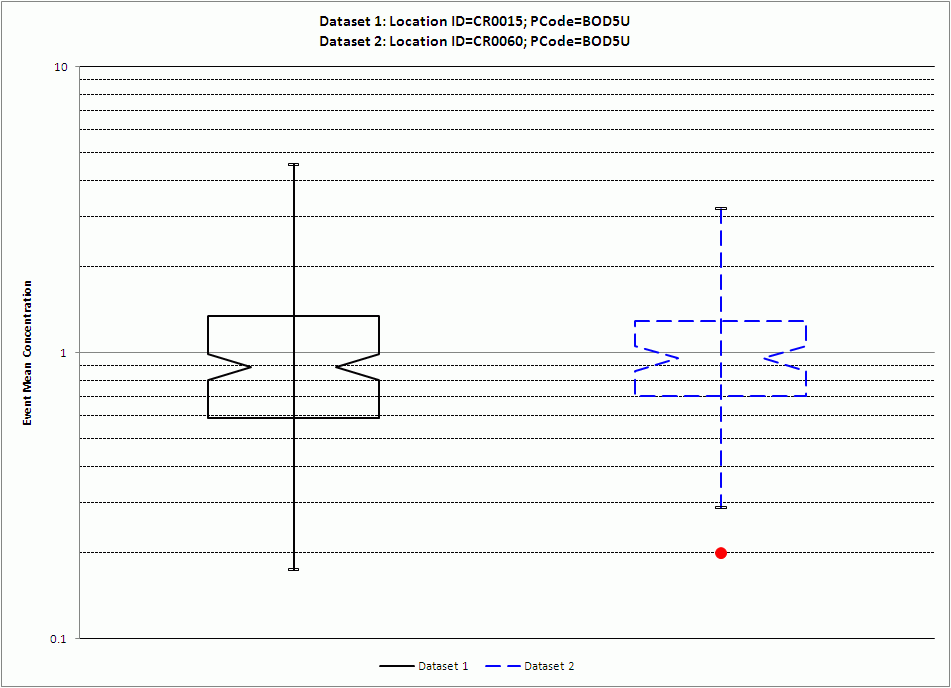
A box and whisker plot is a graphical representation of the statistics of a dataset. See page 19 or the BMP report.
Probability Plots:
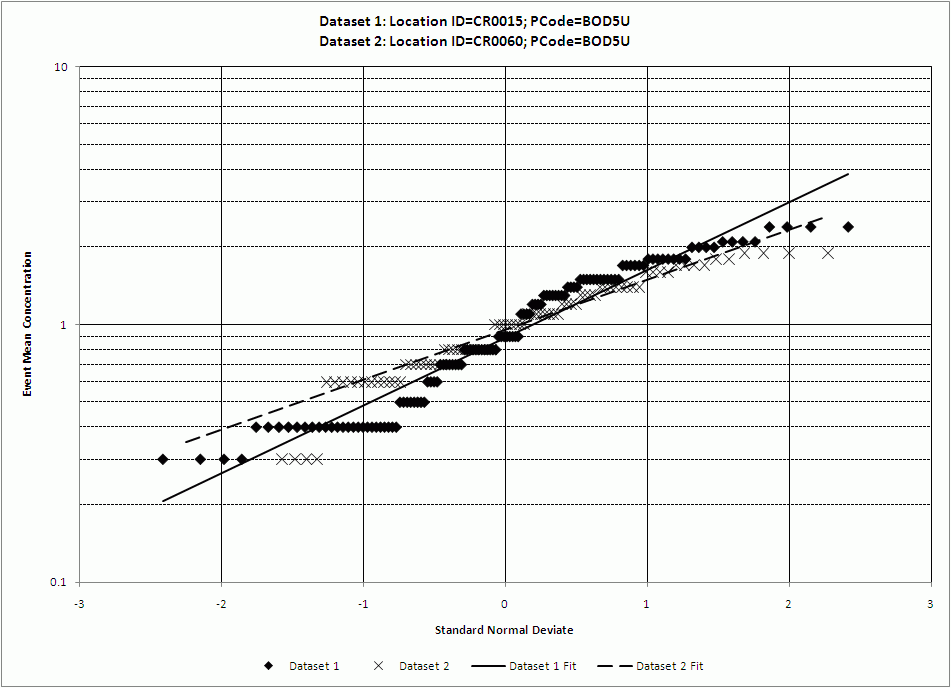
See page 20 of the BMP report.
Time Series Plot:
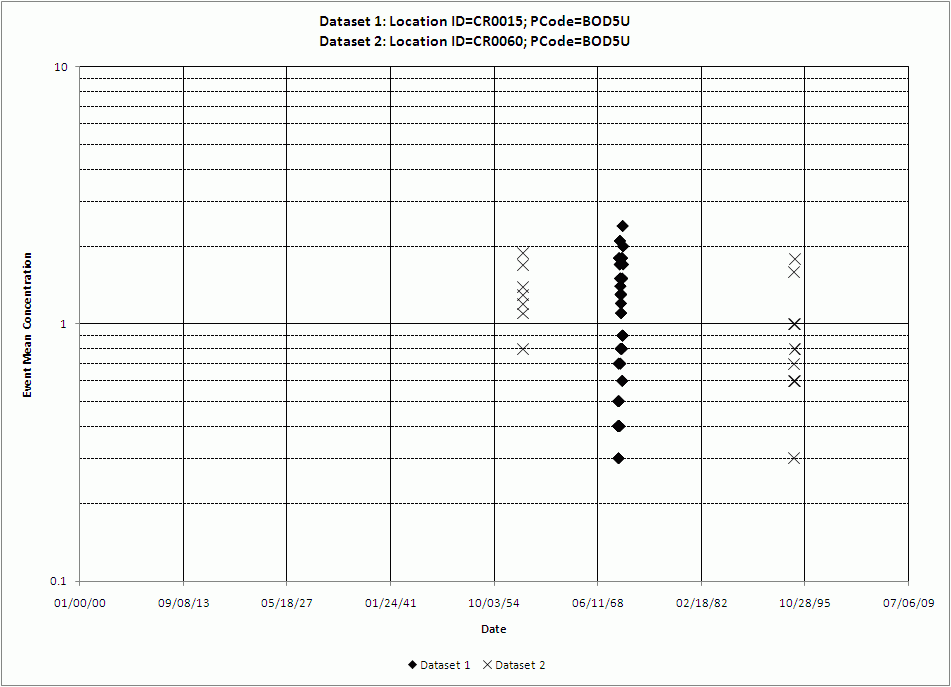
See page 21 of the BMP report.
Input Data:
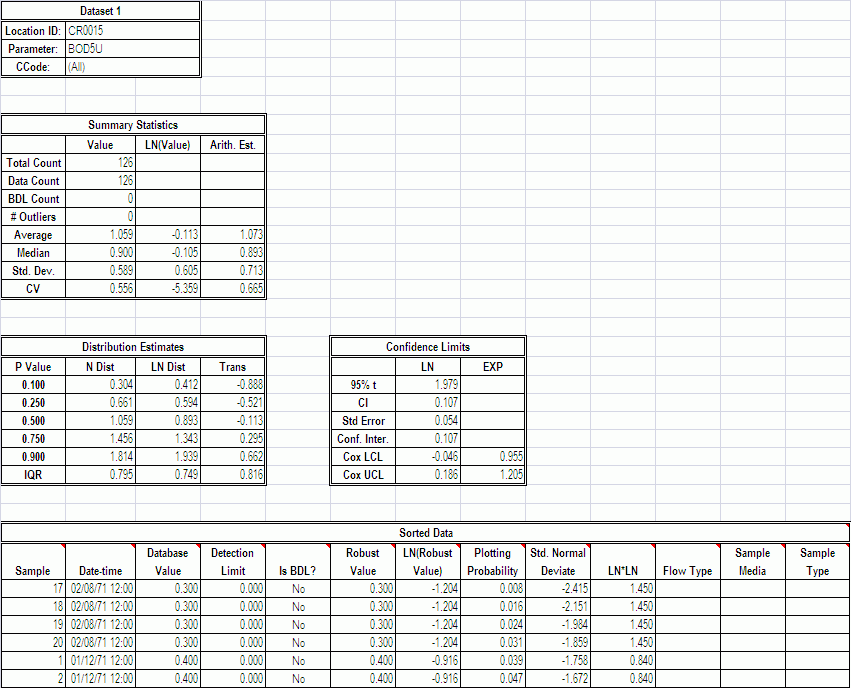
See page 26 of the BMP report.